
Safety first: NASCAR driver Johanna Long and her helmet (via Autowise)
Bulletproof Investing: Week 47 Performance
Each week since the beginning of June 2017, I have presented at least two hedged portfolios created by Portfolio Armor to my Bulletproof Investing subscribers. This is an “investing with a helmet on” approach, and these portfolios are designed to last six months at most. As with any investment method, the returns with this approach will vary. But in the interests of transparency and accountability, I have promised to publicly share the final performance of everything I present, regardless of how it does.
Here, I update the final performance of the three hedged portfolios and the top 10 names (unhedged) that I presented in the 47th week I offered my service. Let’s look at what I presented in week 47 and how it did.
Portfolio 1
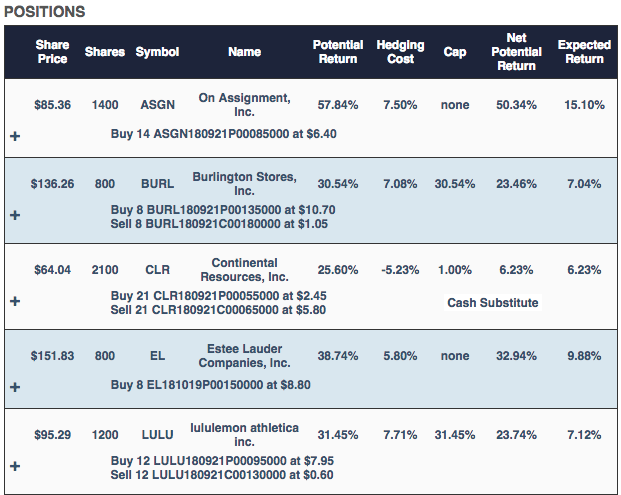
This was the $100,000 portfolio presented here initially. The data below was as of April 19th. The primary securities here were On Assignment (ASGN), Estee Lauder (EL), Mellanox (MLNX), and Old Dominion (ODFL). They were selected because they had the highest potential return estimates, net of hedging costs when hedging against a >15% decline, and they had share prices low enough that you could buy a round lot of one of them for less than $25,000. Continental Resources (CLR) was added in a fine-tuning step to absorb leftover cash from rounding down to round lots of the first four names.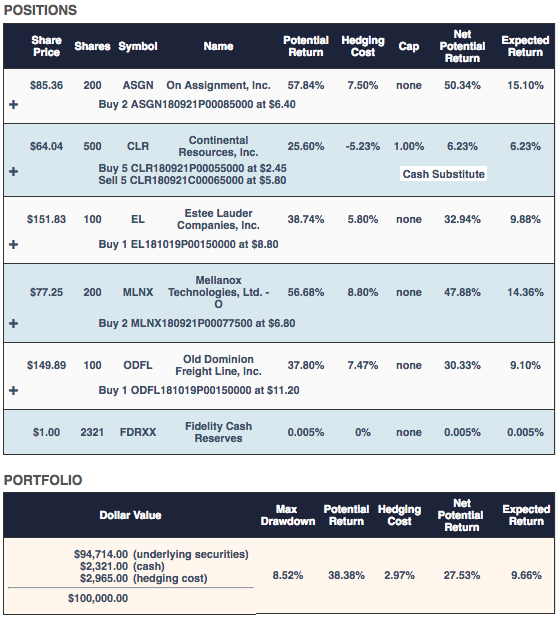
The worst-case scenario for this portfolio was a decline of 8.52% (the “Max Drawdown”), and the best-case scenario was a gain of 27.53% (the “Net Potential Return” or aggregate potential return net of hedging cost). The “Expected Return” of 9.66% was a ballpark estimate taking into account that actual returns, historically, have averaged 0.3x Portfolio Armor’s potential return estimates.
Portfolio 1 Performance
Here’s how the portfolio did, net of hedging and trading costs.
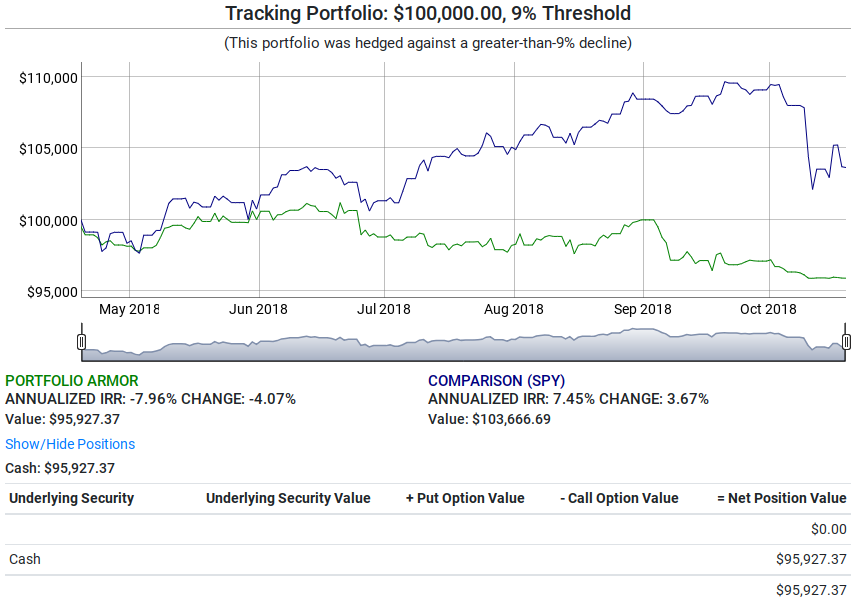
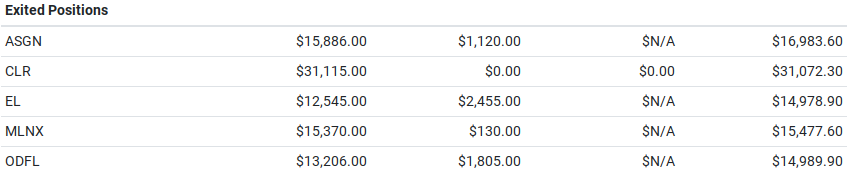
This portfolio was down 4.07%, obviously underperforming its expected return and the return of the SPDR S&P 500 Trust ETF (SPY).
Portfolio 2
This was the $1,000,000 aggressive portfolio presented here initially. This portfolio had BJ’s Restaurants (BJRI), Continental Resources, Copart (CPRT), Lululemon (LULU), Mellanox, NetApp (NTAP), and World Wrestling Entertainment (WWE) as primary securities. Entegris (ENTG) was added in the fine-tuning step to absorb cash left over from the process of rounding down to round lots of the primary securities.
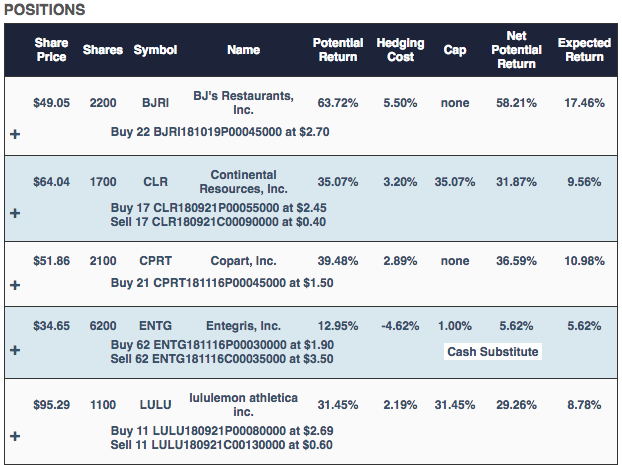
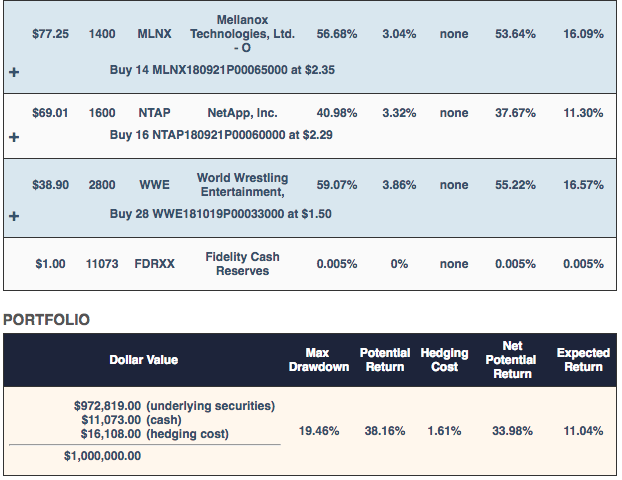
The worst-case scenario for this one was a decline of 19.46%, the best-case scenario was a gain of 33.96%, and the ballpark estimate of an expected return was 11.04%.
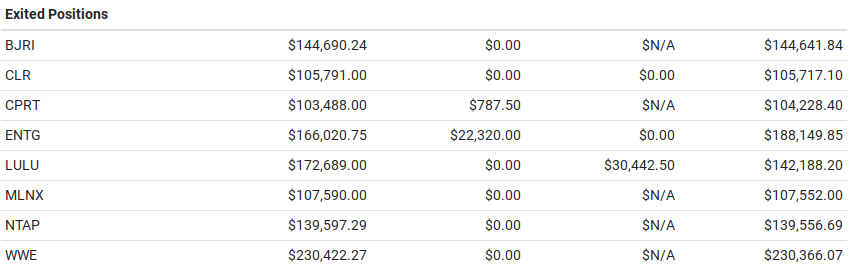
Portfolio 2 Performance
Here’s the performance chart for Portfolio 2:
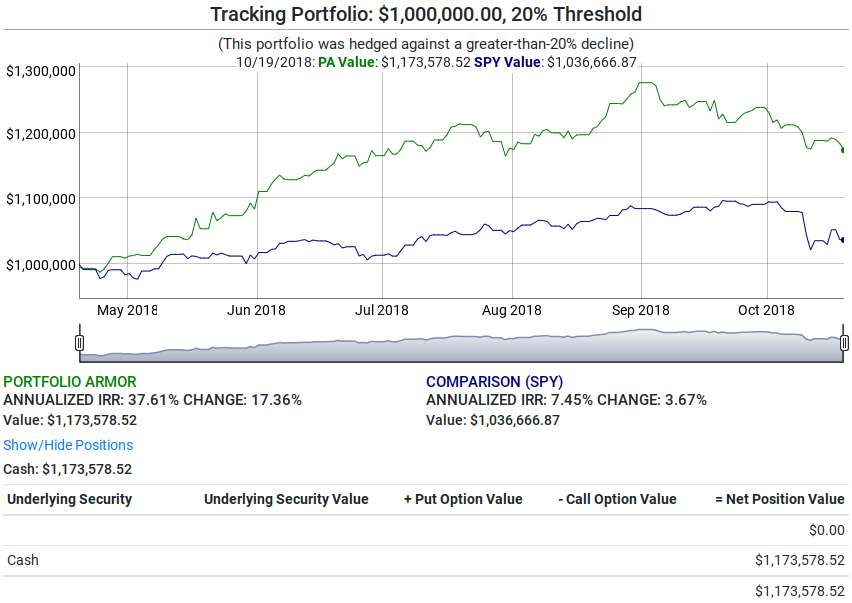
This one was up 17.36%, outperforming its expected return and nearly quintupling the return of SPY.
So far, we have six-month performance data for 30 portfolios I’ve presented hedged against >20% declines. Here’s how all of them have done.
Portfolios Hedged Against > 20.0% Declines
| Starting Date | Expected Return | Actual Return | SPY Return |
|---|---|---|---|
| June 22, 2017 | 8.43% | 20.00% | 11.27% |
| August 31, 2017 | 8.03% | 9.38% | 10.87% |
| October 12, 2017 | 9.00% | 1.81% | 5.38% |
| October 19, 2017 | 10.07% | 13.06% | 6.08% |
| October 26, 2017 | 8.57% | 9.68% | 5.13% |
| November 2, 2017 | 9.77% | 11.11% | 3.11% |
| November 9, 2017 | 9.59% | 4.46% | 5.34% |
| November 16, 2017 | 8.95% | 1.73% | 6.22% |
| November 22, 2017 | 9.39% | 7.25% | 5.90% |
| November 30, 2017 | 8.55% | -4.37% | 3.80% |
| December 8, 2017 | 8.34% | 4.48% | 5.73% |
| December 14, 2017 | 7.75% | 17.49% | 5.87% |
| December 21, 2017 | 9.33% | 12.82% | 3.36% |
| December 28, 2017 | 9.92% | 9.59% | 1.99% |
| January 4, 2018 | 9.65% | 12.96% | 0.59% |
| January 11, 2018 | 8.93% | 8.96% | 1.12% |
| January 18, 2018 | 9.40% | 7.97% | 1.55% |
| January 25, 2018 | 9.82% | 6.21% | 1.10% |
| February 1, 2018 | 9.00% | 0.90% | 0.59% |
| February 8, 2018 | 7.35% | 12.46% | 11.75% |
| February 15, 2018 | 8.19% | -6.17% | 4.08% |
| February 22, 2018 | 8.54% | 6.90% | 6.73% |
| March 1, 2018 | 7.98% | 6.48% | 9.37% |
| March 8, 2018 | 8.32% | -3.2% | 5.82% |
| March 15, 2018 | 7.9% | 2.42% | 6.68% |
| March 22, 2018 | 7.65% | 8.82% | 11.24% |
| March 29, 2018 | 8.26% | 7.72% | 11.48% |
| April 5, 2018 | 10.59% | 0.15% | 9.33% |
| April 12. 2018 | 9.36% | 4.63% | 4.71% |
| April 19, 2018 | 11.04% | 17.36% | 3.67% |
| Average | 8.93% | 7.28% | 5.49% |
Portfolio 3
This was the top name portfolio originally presented here, along with the list of top names. A couple of securities appearing in this portfolio that didn’t appear in the previous ones from this cohort: Burlington Stores (BURL) and Netflix (NFLX).
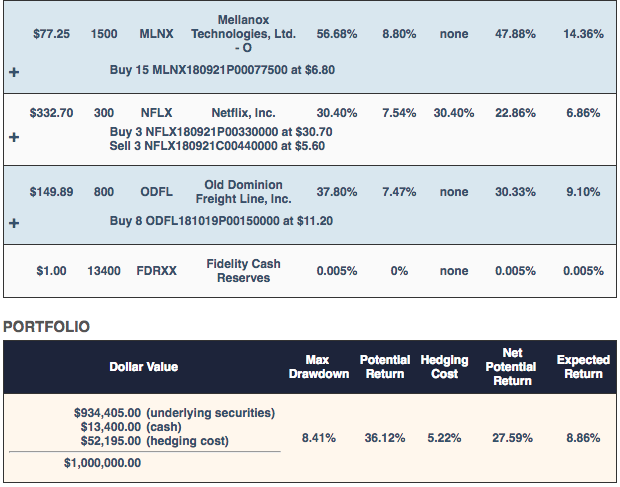
The worst-case scenario for this one was a drawdown of 8.41%, the best-case scenario was a return of 27.59%, and the expected return was 8.86%.
Portfolio 3 Performance
Here’s how it did:
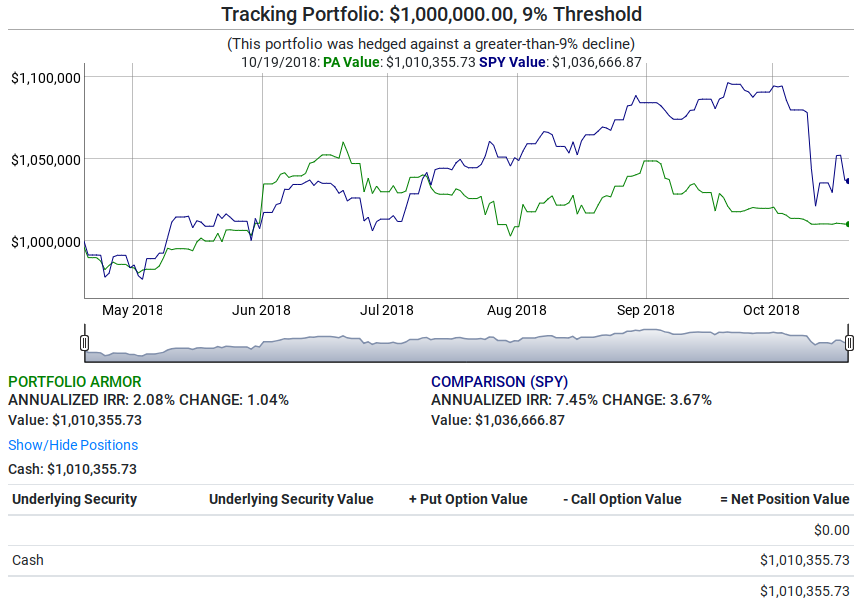
This one was up 1.04%. So far, we have full six-month performance for 49 portfolios I’ve presented hedged against >9% declines, including 2 in this cohort. Here’s how each of them did:
Portfolios Hedged Against > 9.0% Declines
| Starting Date | Expected Return | Actual Return | SPY Return |
|---|---|---|---|
| June 8, 2017 | 6.11% | 9.24% | 9.99% |
| June 16, 2017 | 5.13% | 11.56% | 10.94% |
| July 7, 2017 | 6.29% | 8.47% | 14.07% |
| July 13, 2017 | 6.70% | 13.02% | 14.85% |
| July 20, 2017 | 6.57% | 10.36% | 14.62% |
| August 3, 2017 | 8.46% | 16.52% | 12.66% |
| August 3, 2017 | 8.84% | 14.00% | 12.66% |
| August 10, 2017 | 6.15% | 1.99% | 8.36% |
| August 17, 2017 | 7.06% | 9.38% | 13.48% |
| August 17, 2017 | 8.11% | 9.11% | 13.48% |
| August 24, 2017 | 6.79% | 8.88% | 13.72% |
| August 31, 2017 | 7.43% | 4.67% | 10.87% |
| September 7, 2017 | 6.33% | 9.54% | 11.61% |
| September 14, 2017 | 7.25% | 11.28% | 11.19% |
| September 22, 2017 | 6.41% | 10.64% | 6.67% |
| September 28, 2017 | 6.27% | 8.36% | 4.73% |
| October 5, 2017 | 8.36% | 8.73% | 5.26% |
| October 5, 2017 | 7.33% | 4.67% | 5.26% |
| October 12, 2017 | 6.58% | 5.03% | 5.38% |
| October 19, 2017 | 7.91% | 9.66% | 6.08% |
| October 26, 2017 | 7.63% | 9.43% | 5.13% |
| November 2, 2017 | 6.15% | 4.72% | 3.11% |
| November 9, 2017 | 7.09% | -1.49% | 5.34% |
| November 16, 2017 | 7.13% | 3.20% | 6.22% |
| November 22, 2017 | 6.76% | -0.87% | 5.90% |
| November 30, 2017 | 6.53% | -2.01% | 3.80% |
| December 8, 2017 | 5.10% | 4.84% | 5.73% |
| December 14, 2017 | 6.75% | 13.48% | 5.87% |
| December 14, 2017 | 6.15% | 12.48% | 5.87% |
| December 21, 2017 | 6.70% | 0.81% | 3.36% |
| December 28, 2017 | 7.70% | 15.10% | 1.99% |
| December 28, 2017 | 7.88% | 6.22% | 1.99% |
| January 4, 2018 | 9.30% | 15.19% | 0.59% |
| January 4, 2018 | 8.65% | 10.87% | 0.59% |
| January 11, 2018 | 7.59% | -3.05% | 1.12% |
| January 18, 2018 | 6.81% | -0.23% | 1.55% |
| January 25, 2018 | 8.66% | 3.47% | 1.10% |
| February 1, 2018 | 6.59% | 1.69% | 0.59% |
| February 8, 2018 | 4.74% | 8.05% | 11.75% |
| February 15, 2018 | 6.37% | -1.95% | 4.08% |
| February 22, 2018 | 5.44% | 1.72% | 6.73% |
| March 1, 2018 | 5.05% | 4.69% | 9.37% |
| March 8, 2018 | 6.39% | -3.74% | 5.82% |
| March 15, 2018 | 5.23% | 1.33% | 6.68% |
| March 22, 2018 | 5.98% | 4.01% | 11.24% |
| March 29, 2018 | 5.93% | 4.77% | 11.48% |
| April 5, 2018 | 6.91% | 3.41% | 9.33% |
| April 12, 2018 | 9.09% | -2.72% | 4.71% |
| April 12, 2018 | 8.35% | -0.63% | 4.71% |
| April 19, 2018 | 8.86% | 1.04% | 3.67% |
| April 19, 2018 | 9.66% | -4.07% | 3.67% |
| Average | 6.98% | 5.97% | 7.24% |
One note about the table above: it includes both $100k portfolios and $1mm portfolios. Starting in May, I started presenting $100k portfolios hedged against >14% declines, so they’ll appear in a different table going forward. My guess is that will slightly improve the average performance of the portfolios hedged against >9% declines.
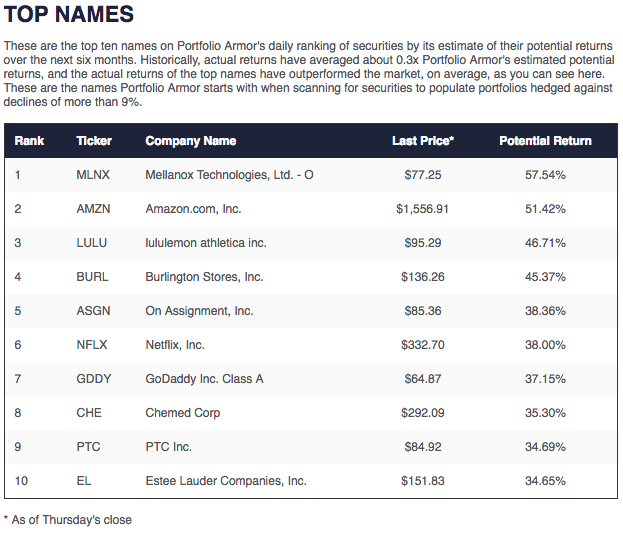
Top Names
These were Portfolio Armor’s top 10 names as of April 19th. Names that didn’t appear in the portfolios above include: Amazon (AMZN), GoDaddy (GDDY), Chemed (CHE), and PTC (PTC).
Top Names Performance
Here’s how the top names did:
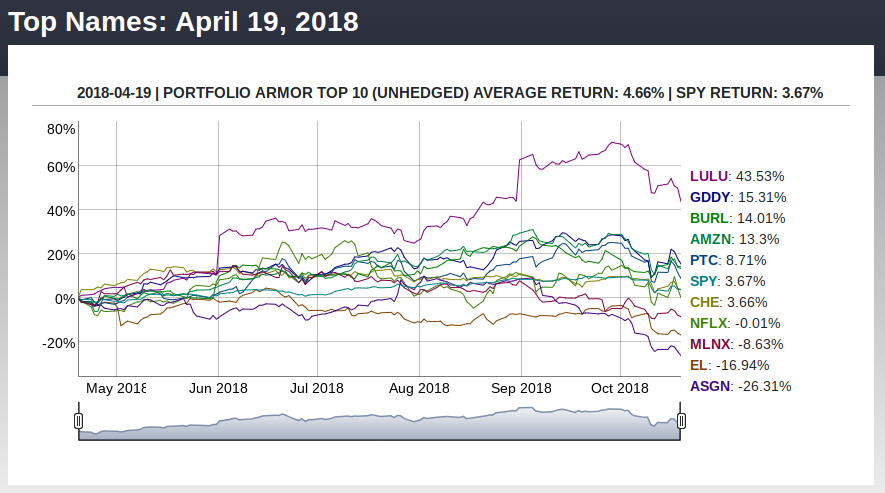
The top names returned 4.66%, versus 3.67% for SPY. So far, 37 top names cohorts have beaten SPY, 1 has tied SPY, and 8, have underperformed SPY over the next six months. You can see the performance for all of the top names cohorts I’ve presented so far in the table below (you can find interactive charts for all of these tables under the performance tab on Portfolio Armor).
| Starting Date | Portfolio Armor 6-Month Performance | SPY 6-Month Performance |
|---|---|---|
| June 8, 2017 | 14.49% | 9.99% |
| June 15, 2017 | 19.85% | 10.97% |
| June 22, 2017 | 24.46% | 11.27% |
| June 29, 2017 | 18.24% | 11.68% |
| July 6, 2017 | 21.03% | 14.81% |
| July 13, 2017 | 28.25% | 14.85% |
| July 20, 2017 | 25.04% | 14.62% |
| July 27, 2017 | 33.52% | 17.10% |
| August 3, 2017 | 20.72% | 12.66% |
| August 10, 2017 | 13.05% | 8.36% |
| August 17, 2017 | 10.71% | 13.48% |
| August 24, 2017 | 15.23% | 13.72% |
| August 31, 2017 | 8.42% | 10.87% |
| September 7, 2017 | 12.75% | 11.61% |
| September 14, 2017 | 29.19% | 11.19% |
| September 21, 2017 | 22.56% | 9.42% |
| September 28, 2017 | 14.30% | 4.73% |
| October 5, 2017 | 11.53% | 5.26% |
| October 12, 2017 | 15.46% | 5.38% |
| October 19, 2017 | 20.73% | 6.08% |
| October 26, 2017 | 18.10% | 5.13% |
| November 2, 2017 | 12.64% | 3.11% |
| November 9, 2017 | 5.41% | 5.34% |
| November 16, 2017 | 6.11% | 6.22% |
| November 23, 2017 | 5.18% | 6.19% |
| November 30, 2017 | -0.19% | 3.80% |
| December 7, 2017 | 11.51% | 5.99% |
| December 14, 2017 | 29.80% | 5.87% |
| December 21, 2017 | 17.11% | 3.36% |
| December 28, 2017 | 13.78% | 1.99% |
| January 4, 2018 | 30.22% | 0.59% |
| January 11, 2018 | -2.06% | 1.12% |
| January 18, 2018 | 7% | 1.55% |
| January 25, 2018 | 1.73% | 1.1% |
| February 1, 2018 | 11.02% | 0.59% |
| February 8, 2018 | 25.21% | 11.75% |
| February 15, 2018 | 4.31% | 4.08% |
| February 22, 2018 | 19.48% | 6.73% |
| March 1, 2018 | 10.64% | 9.37% |
| March 8, 2018 | 5.82% | 5.82% |
| March 15, 2018 | 6.99% | 6.68% |
| March 22, 2018 | 8.64% | 11.24% |
| March 29, 2018 | 14.68% | 11.48% |
| April 5, 2018 | 9.76% | 9.33% |
| April 12, 2018 | -2.29% | 4.71% |
| April 19, 2018 | 4.66% | 3.67% |
| Average | 14.23% | 7.72% |
So Portfolio Armor’s top ten names averaged 14.23% over the average of these 46 6-month periods, versus SPY’s average of 7.72%, an average outperformance of 6.51% over 6 months.
Top Names Time-Stamped
For a few months, in addition to posting those top names in my Seeking Alpha Marketplace service, I also time-stamped them on Twitter. If you click on the tweet shown below and scroll down, it will take you to a thread showing those time-stamped posts as well as charts of their subsequent performance.
Week 47 Assessment
An improvement on week 46. 2 out of 3 portfolios underperformed their expected returns, but the one that outperformed its expected return also nearly quintupled the performance of the market. The top 10 names (unhedged) outperformed SPY for the 37th time out of 45 weeks (we didn’t post the top 10 in week 1).
Amazon didn’t appear in any of the portfolios because its share price was too high to fit a round lot of it in a $1 million portfolio. I added $2 million portfolios starting in May to capture it and other high share price top names.
We still see the potential variability of hedged portfolio returns from week to week, but the proximity between the average expected returns and average actual returns in the tables above remains encouraging (particularly with the portfolios hedged against >9% declines), because it suggests that with four entries per year (putting half of your money in a hedged portfolio now, half in three months, and repeating the process when those portfolios end), your actual returns will likely come close to your average expected returns.
To see this week’s top names and hedged portfolios, you can sign up for a 2-week free trial here.
Disclosure: I/we have no positions in any stocks mentioned, and no plans to initiate any positions within the next 72 hours.
I wrote this article myself, and it expresses my own opinions. I am not receiving compensation for it (other than from Seeking Alpha). I have no business relationship with any company whose stock is mentioned in this article.