The precious metals are busy finishing the anticipated pullback to the former support, which is almost within our grasp on the short-term charts. So, let it go and in the meantime we can look into the bigger charts with higher time frames to update the outlook beyond the short-term horizon.
Chart 1. Gold Monthly: 1122/1375
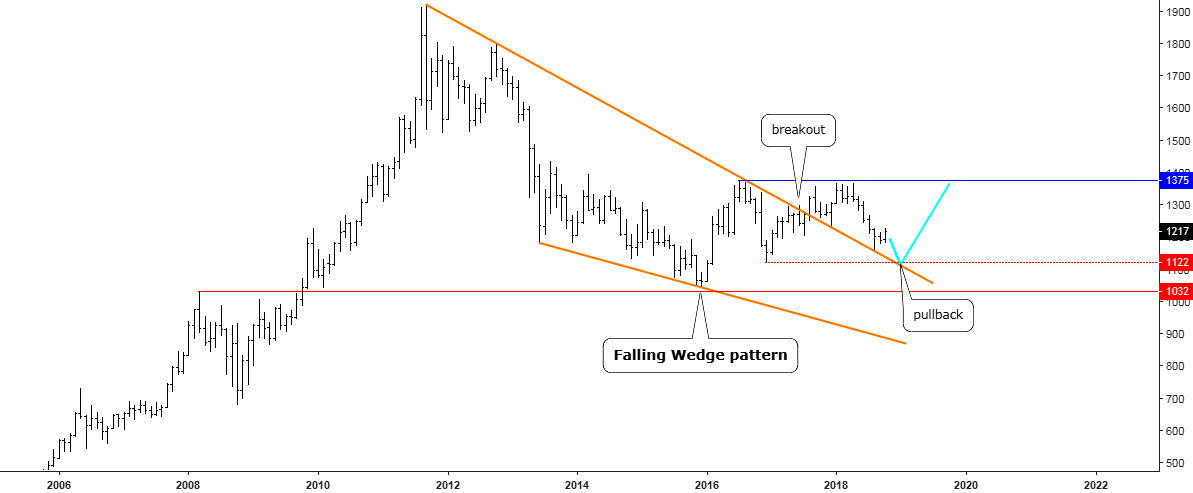
Chart courtesy of tradingview.com
The monthly gold chart above answers some critical questions. The first one, why gold reversed ahead of $1000? The answer is the red horizontal line, which was set at the 2008 top and acted as strong support and breakdown of it would unleash severe volatility into the market as the next level of serious technical support is located in the $700 area (2006 top/2008 bottom).
The second one, why I think gold should retest the earlier trough at $1122 as highlighted with the turquoise zigzag? There is a crossover of two crucial supports in this area: the red dotted line is the bottom of the current range coincides with the orange trendline of the former resistance of the Falling Wedge pattern. So the drop in the $1122 level would complete the pullback, which should retrace the breakout that occurred last summer. It corresponds perfectly to the weekly gold chart I posted in August.
The turquoise zigzag bounces into the area of 2016 and 2018 highs around $1375 where we will see what’s next so let us wait. We could spend another half a year or so before gold would hit it based on the model of the past historical periods.
Chart 2. Silver Monthly: 8.45?
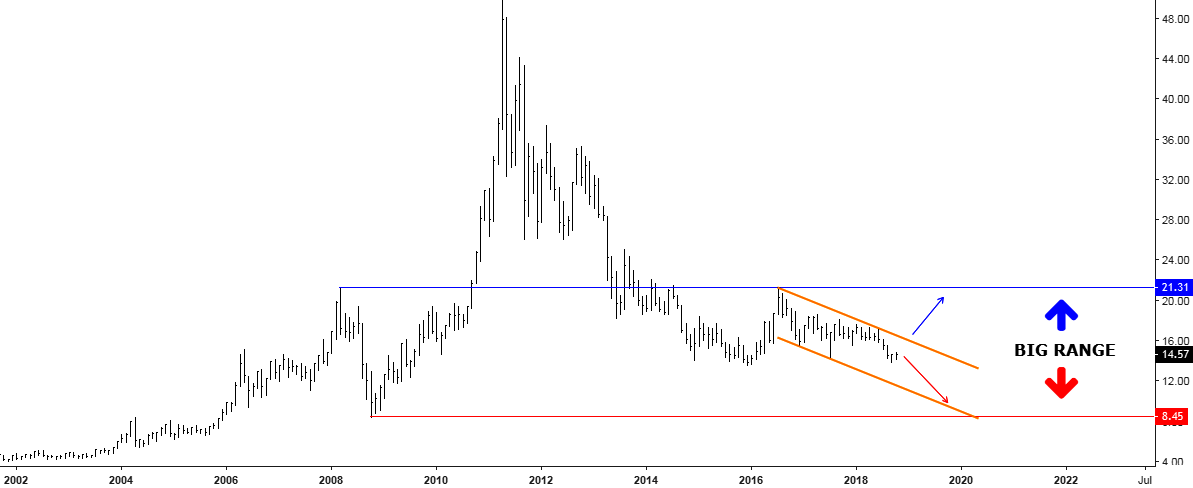
Chart courtesy of tradingview.com
This silver chart above represents the total recast as first of all I removed the $13.65 support from it. Why did I do that? Because recently we almost smashed it as the price dipped below the $14 handle. In the long run, we are just drifting within a big-big range between the extremes established in 2008. The bottom of the range is at $8.45, and the top of the range is at $21.31. The latter one was already retested in 2016, but silver failed there, so now we are moving in the opposite direction.
The orange downtrend was built through two extreme points on both sides, and the price is right in the middle of it. Now I’m starting to understand why I subconsciously gave the title for my May post “Silver looks into the DARK ABYSS” although I didn’t see these dim prospects then. This downtrend projects more weakness in the white metal as the downside is located at $11.5 while the saving invalidation is far above $16.5.
It looks like the silver market is still in captivity of psychological trauma as it recalls the 2008 drop, which erased three-quarters of the gain accumulated since 2001. But let us give silver a try as $13.65 was left untouched.
Why Gold Shines, But Silver Doesn’t?
The gold prospects look brighter than the silver outlook and readers could be puzzled. The answer is in the position of the price of each metal in the charts. I already warned gold bugs about the turbulent area below the $1000 level down to the $700 level. I was there to witness the shock in the market caused by the wild volatility amid broken hopes. In this aspect, the gold is still in the safe area above it, thanks to the central banks, which strong buying activity this year supports the metal.
Silver had entered that “abyss” or “swamp” or “turbulence” long ago in a distant 2013. In 2016 silver bugs tried to push the metal out of this trap but failed. The following orange downtrend has the strong angle down by 45 degrees. And it looks like the market follows the rule: to revive one should reach the very bottom, i.e., $8.45 in the absence of large buyers.
Sometimes gold leads sometimes silver does. Let’s see if gold’s expected bounce can drag silver out of the “swamp.”
Intelligent trades!
Aibek Burabayev
INO.com Contributor, Metals
Disclosure: This contributor has no positions in any stocks mentioned in this article. This article is the opinion of the contributor themselves. The above is a matter of opinion provided for general information purposes only and is not intended as investment advice. This contributor is not receiving compensation (other than from INO.com) for their opinion.