Please note: This article was first released to CEF/ETF Income Laboratory members 1 month ago, so data may be out of date. Please check latest data before making investment decisions.
Quantitative screens help to rapidly narrow down attractive candidates from the database of 500+ closed-end funds [CEFs] for further due diligence and investigation. The “High-High-Low” was inspired by a member of CEF/ETF Income Laboratory (who also receive these reports one month ahead of the public), who wrote:
Stanford, you should do follow up article on CEF that distribute 8%+, have 90% or more coverage and trade under NAV. What does that look like in today’s world? How many funds are doing that?
What are the Z scores? I think many investors would be interested who are pushing for higher yield to identify best in class of aggressive funds that are coming close to covering dividends. Allows people to reevaluation risk/reward.
The “High-High-Low” report, therefore, screens for the following 3 attributes that we would like to screen for:
- High distributions (>7.5%) (i.e., 7.5% or higher yields)
- High coverage (>90%) (i.e., 90% or better coverage)
- Low premium/discount value (<0%) (i.e., trading at a discount)
Note that the above thresholds are subject to change, based on the number of eligible CEFs there are that satisfy all three of the criteria. I try to aim for a minimum of at least 20 eligible funds so that the “top 10” list actually means something (top 50% of the screen).
As for the Quality CEF report, I should mention some caveats about using coverage as a screen. Firstly, the coverage ratios are calculated using earnings data from CEFConnect. No efforts have been made to independently verify the coverage ratios from the individual fund annual/semi-annual reports themselves. Secondly, having a coverage ratio >90% does not guarantee that the fund’s distribution is secure.
Many funds reduce their distributions periodically in line with market conditions in order to maintain good coverage. Thirdly, a coverage cut-off ratio of 90% is, ultimately, an arbitrary number. A fund with 89.9% coverage will be excluded from the rankings, whereas funds with 90.1% coverage will be considered, even though only a sliver of coverage separates the two.
I should also note that having both high yields and less than 100% coverage (though greater than 90%) makes this a more aggressive screen compared to the Quality report (which only selects for >100% coverage). Furthermore, note that because the universe of eligible funds is pretty small, some of the CEFs will appear in multiple top lists, just in a different order…
I hope that these rankings of “high-high-low” CEFs will provide fertile grounds for further exploration.
Key to table headings:
P/D = premium/discount
Z = 1-year z-score
Lev = leverage
BE = baseline expense
Cov = coverage
Data were taken from CEFConnect on the close of September 22, 2018.
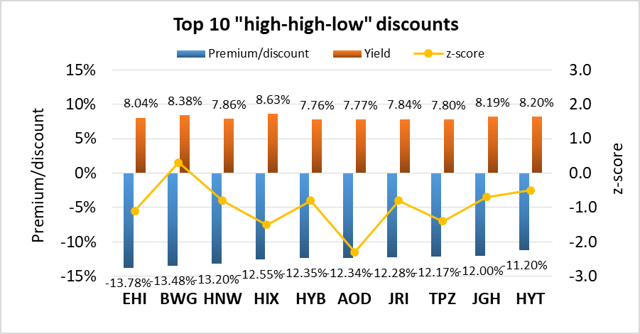
1. Top 10 highest “high-high-low” discounts
The following data show the 10 CEFs with the highest discounts, yield >7.5% and coverage >90%. z-scores, leverage and baseline expense are shown for comparison.
|
CEF |
Category |
P/D |
Yield |
Z |
Lev |
BE |
Cov |
|
(EHI) |
Non-US/Other-Global Income |
-13.78% |
8.04% |
-1.1 |
25% |
1.22% |
96% |
|
(BWG) |
Non-US/Other-Global Income |
-13.48% |
8.38% |
0.3 |
37% |
1.53% |
102% |
|
(HNW) |
Taxable Income-High Yield |
-13.20% |
7.86% |
-0.8 |
31% |
1.47% |
109% |
|
(HIX) |
Taxable Income-High Yield |
-12.55% |
8.63% |
-1.5 |
26% |
0.07% |
97% |
|
(HYB) |
Taxable Income-High Yield |
-12.35% |
7.76% |
-0.8 |
27% |
1.14% |
100% |
|
(AOD) |
Non-US/Other-Global Equity Dividend |
-12.34% |
7.77% |
-2.3 |
9% |
1.15% |
117% |
|
(JRI) |
US Equity-Real Estate (Global) |
-12.28% |
7.84% |
-0.8 |
30% |
1.58% |
100% |
|
(TPZ) |
US Equity-Growth & Income |
-12.17% |
7.80% |
-1.4 |
25% |
1.55% |
93% |
|
(JGH) |
Non-US/Other-Global Income |
-12.00% |
8.19% |
-0.7 |
30% |
1.31% |
101% |
|
(HYT) |
Taxable Income-High Yield |
-11.20% |
8.20% |
-0.5 |
30% |
0.91% |
96% |
(Source: CEFConnect, Stanford Chemist)
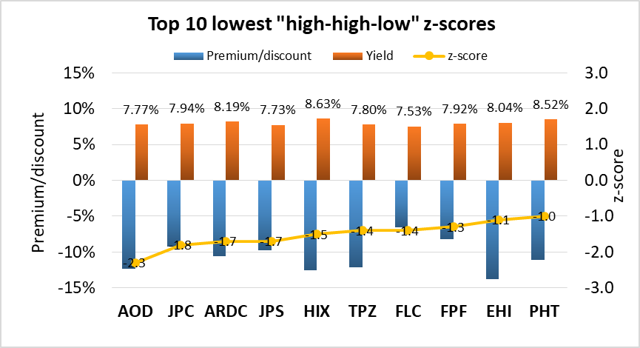
2. Top 10 lowest “high-high-low” z-scores
The following data show the 10 CEFs with the lowest z-scores, yield >8%, coverage >90% and premium/discount <0%. Leverage and baseline expense are shown for comparison.
|
CEF |
Category |
Z |
P/D |
Yield |
Lev |
BE |
Cov |
|
(AOD) |
Non-US/Other-Global Equity Dividend |
-2.3 |
-12.34% |
7.77% |
9% |
1.15% |
117% |
|
(JPC) |
Taxable Income-Preferreds |
-1.8 |
-9.27% |
7.94% |
35% |
1.21% |
97% |
|
(ARDC) |
Taxable Income-Senior Loan |
-1.7 |
-10.61% |
8.19% |
29% |
1.97% |
104% |
|
(JPS) |
Taxable Income-Preferreds |
-1.7 |
-9.82% |
7.73% |
35% |
1.26% |
101% |
|
(HIX) |
Taxable Income-High Yield |
-1.5 |
-12.55% |
8.63% |
26% |
0.07% |
97% |
|
(TPZ) |
US Equity-Growth & Income |
-1.4 |
-12.17% |
7.80% |
25% |
1.55% |
93% |
|
(FLC) |
Taxable Income-Preferreds |
-1.4 |
-6.53% |
7.53% |
33% |
1.17% |
93% |
|
(FPF) |
Taxable Income-Preferreds |
-1.3 |
-8.19% |
7.92% |
30% |
1.31% |
104% |
|
(EHI) |
Non-US/Other-Global Income |
-1.1 |
-13.78% |
8.04% |
25% |
1.22% |
96% |
|
(PHT) |
Taxable Income-High Yield |
-1.0 |
-11.15% |
8.52% |
29% |
1.08% |
110% |
(Source: CEFConnect, Stanford Chemist)
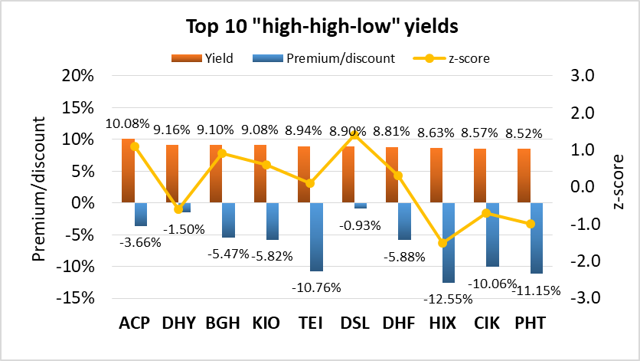
3. Top 10 highest “high-high-low” yields
The following data show the 10 CEFs with the highest yields, coverage >90% and premium/discount <0%. z-scores, leverage, and baseline expense are shown for comparison.
|
CEF |
Category |
Yield |
P/D |
Z |
Lev |
BE |
Cov |
|
(ACP) |
Taxable Income-Senior Loan |
10.08% |
-3.66% |
1.1 |
30% |
2.25% |
112% |
|
(DHY) |
Taxable Income-High Yield |
9.16% |
-1.50% |
-0.6 |
31% |
1.53% |
95% |
|
(BGH) |
Taxable Income-High Yield |
9.10% |
-5.47% |
0.9 |
26% |
1.60% |
108% |
|
(KIO) |
Taxable Income-High Yield |
9.08% |
-5.82% |
0.6 |
30% |
1.96% |
100% |
|
(TEI) |
Non-US/Other-Emerging Market Income |
8.94% |
-10.76% |
0.1 |
0% |
1.08% |
95% |
|
(DSL) |
Taxable Income-Multi-Sector |
8.90% |
-0.93% |
1.4 |
29% |
1.66% |
100% |
|
(DHF) |
Taxable Income-High Yield |
8.81% |
-5.88% |
0.3 |
31% |
1.27% |
93% |
|
(HIX) |
Taxable Income-High Yield |
8.63% |
-12.55% |
-1.5 |
26% |
0.07% |
97% |
|
(CIK) |
Taxable Income-High Yield |
8.57% |
-10.06% |
-0.7 |
7% |
0.78% |
105% |
|
(PHT) |
Taxable Income-High Yield |
8.52% |
-11.15% |
-1.0 |
29% |
1.08% |
110% |
(Source: CEFConnect, Stanford Chemist)
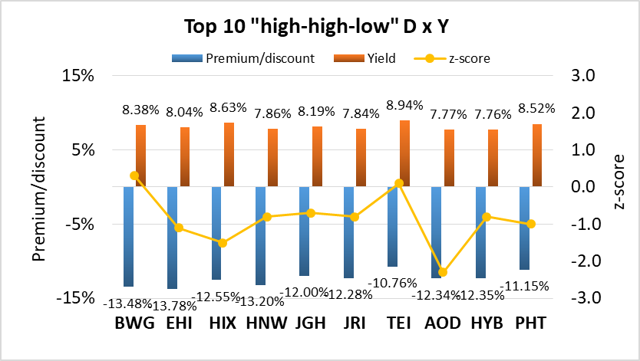
4. Top 10 best combination of “high-high-low” yield and discount
For possible buy candidates, it is probably a good idea to consider both yield and discount. Buying a CEF with both a high yield and discount not only gives you the opportunity to capitalize from discount contraction, but you also get “free” alpha every time the distribution is paid out. This is because paying out a distribution is effectively the same as liquidating the fund at NAV and returning the capital to the unitholders. I considered several ways to rank CEFs by a composite metric of both yield and discount.
The simplest would be yield + discount, however I disregarded this because yields and discounts may have different ranges of absolute values and a sum would be biased towards the larger set of values. I finally settled on the multiplicative product, yield x discount. This is because I consider a CEF with 7% yield and 7% discount to be more desirable than a fund with 2% yield and 12% discount, or 12% yield and 2% discount, even though each pair of quantities sum to 14%.
Multiplying yield and discount together biases towards funds with both high yield and discount. Since discount is negative and yield is positive, the more negative the “D x Y” metric, the better. Only funds with >7.5% yield, >90% coverage and <0% premium/discount are considered.
|
CEF |
Category |
P/D |
Yield |
Z |
D x Y |
Lev |
BE |
Cov |
|
(BWG) |
Non-US/Other-Global Income |
-13.48% |
8.38% |
0.3 |
-1.13 |
37% |
1.53% |
102% |
|
(EHI) |
Non-US/Other-Global Income |
-13.78% |
8.04% |
-1.1 |
-1.11 |
25% |
1.22% |
96% |
|
(HIX) |
Taxable Income-High Yield |
-12.55% |
8.63% |
-1.5 |
-1.08 |
26% |
0.07% |
97% |
|
(HNW) |
Taxable Income-High Yield |
-13.20% |
7.86% |
-0.8 |
-1.04 |
31% |
1.47% |
109% |
|
(JGH) |
Non-US/Other-Global Income |
-12.00% |
8.19% |
-0.7 |
-0.98 |
30% |
1.31% |
101% |
|
(JRI) |
US Equity-Real Estate (Global) |
-12.28% |
7.84% |
-0.8 |
-0.96 |
30% |
1.58% |
100% |
|
(TEI) |
Non-US/Other-Emerging Market Income |
-10.76% |
8.94% |
0.1 |
-0.96 |
0% |
1.08% |
95% |
|
(AOD) |
Non-US/Other-Global Equity Dividend |
-12.34% |
7.77% |
-2.3 |
-0.96 |
9% |
1.15% |
117% |
|
(HYB) |
Taxable Income-High Yield |
-12.35% |
7.76% |
-0.8 |
-0.96 |
27% |
1.14% |
100% |
|
(PHT) |
Taxable Income-High Yield |
-11.15% |
8.52% |
-1.0 |
-0.95 |
29% |
1.08% |
110% |
(Source: CEFConnect, Stanford Chemist)
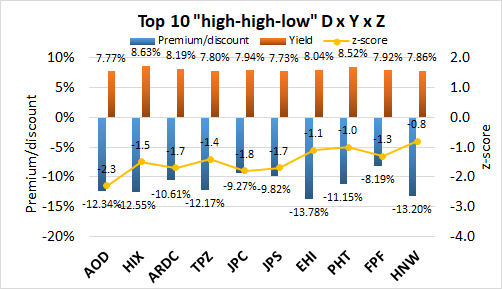
5. Top 10 best combination of “high-high-low” yield, discount and z-score
This is my favorite metric because it takes into account all three factors that I always consider when buying or selling CEFs: yield, discount and z-score. The composite metric simply multiplies the three quantities together. A screen is applied to only include CEFs with a negative 1-year z-score. As both discount and z-score are negative while yield is positive, the more positive the “D x Y x Z” metric, the better. Only funds with >7.5% yield, >90% coverage and <0% premium/discount are considered.
|
CEF |
Category |
P/D |
Yield |
Z |
D x Y x Z |
Lev |
BE |
Cov |
|
(AOD) |
Non-US/Other-Global Equity Dividend |
-12.34% |
7.77% |
-2.3 |
2.21 |
9% |
1.15% |
117% |
|
(HIX) |
Taxable Income-High Yield |
-12.55% |
8.63% |
-1.5 |
1.62 |
26% |
0.07% |
97% |
|
(ARDC) |
Taxable Income-Senior Loan |
-10.61% |
8.19% |
-1.7 |
1.48 |
29% |
1.97% |
104% |
|
(TPZ) |
US Equity-Growth & Income |
-12.17% |
7.80% |
-1.4 |
1.33 |
25% |
1.55% |
93% |
|
(JPC) |
Taxable Income-Preferreds |
-9.27% |
7.94% |
-1.8 |
1.32 |
35% |
1.21% |
97% |
|
(JPS) |
Taxable Income-Preferreds |
-9.82% |
7.73% |
-1.7 |
1.29 |
35% |
1.26% |
101% |
|
(EHI) |
Non-US/Other-Global Income |
-13.78% |
8.04% |
-1.1 |
1.22 |
25% |
1.22% |
96% |
|
(PHT) |
Taxable Income-High Yield |
-11.15% |
8.52% |
-1.0 |
0.95 |
29% |
1.08% |
110% |
|
(FPF) |
Taxable Income-Preferreds |
-8.19% |
7.92% |
-1.3 |
0.84 |
30% |
1.31% |
104% |
|
(HNW) |
Taxable Income-High Yield |
-13.20% |
7.86% |
-0.8 |
0.83 |
31% |
1.47% |
109% |
(Source: CEFConnect, Stanford Chemist)
We’re currently offering a limited time only free trial for the CEF/ETF Income Laboratory with a 20% discount for first-time subscribers. Members receive an early look at all public content together with exclusive and actionable commentary on specific funds. We also offer managed closed-end fund (CEF) and exchange-traded fund (ETF) portfolios targeting ~8% yield. The sale ends on October 31, 2018, so please consider joining us by clicking on the following link: CEF/ETF Income Laboratory.

Disclosure: I am/we are long THE PORTFOLIO SECURITIES.
I wrote this article myself, and it expresses my own opinions. I am not receiving compensation for it (other than from Seeking Alpha). I have no business relationship with any company whose stock is mentioned in this article.